

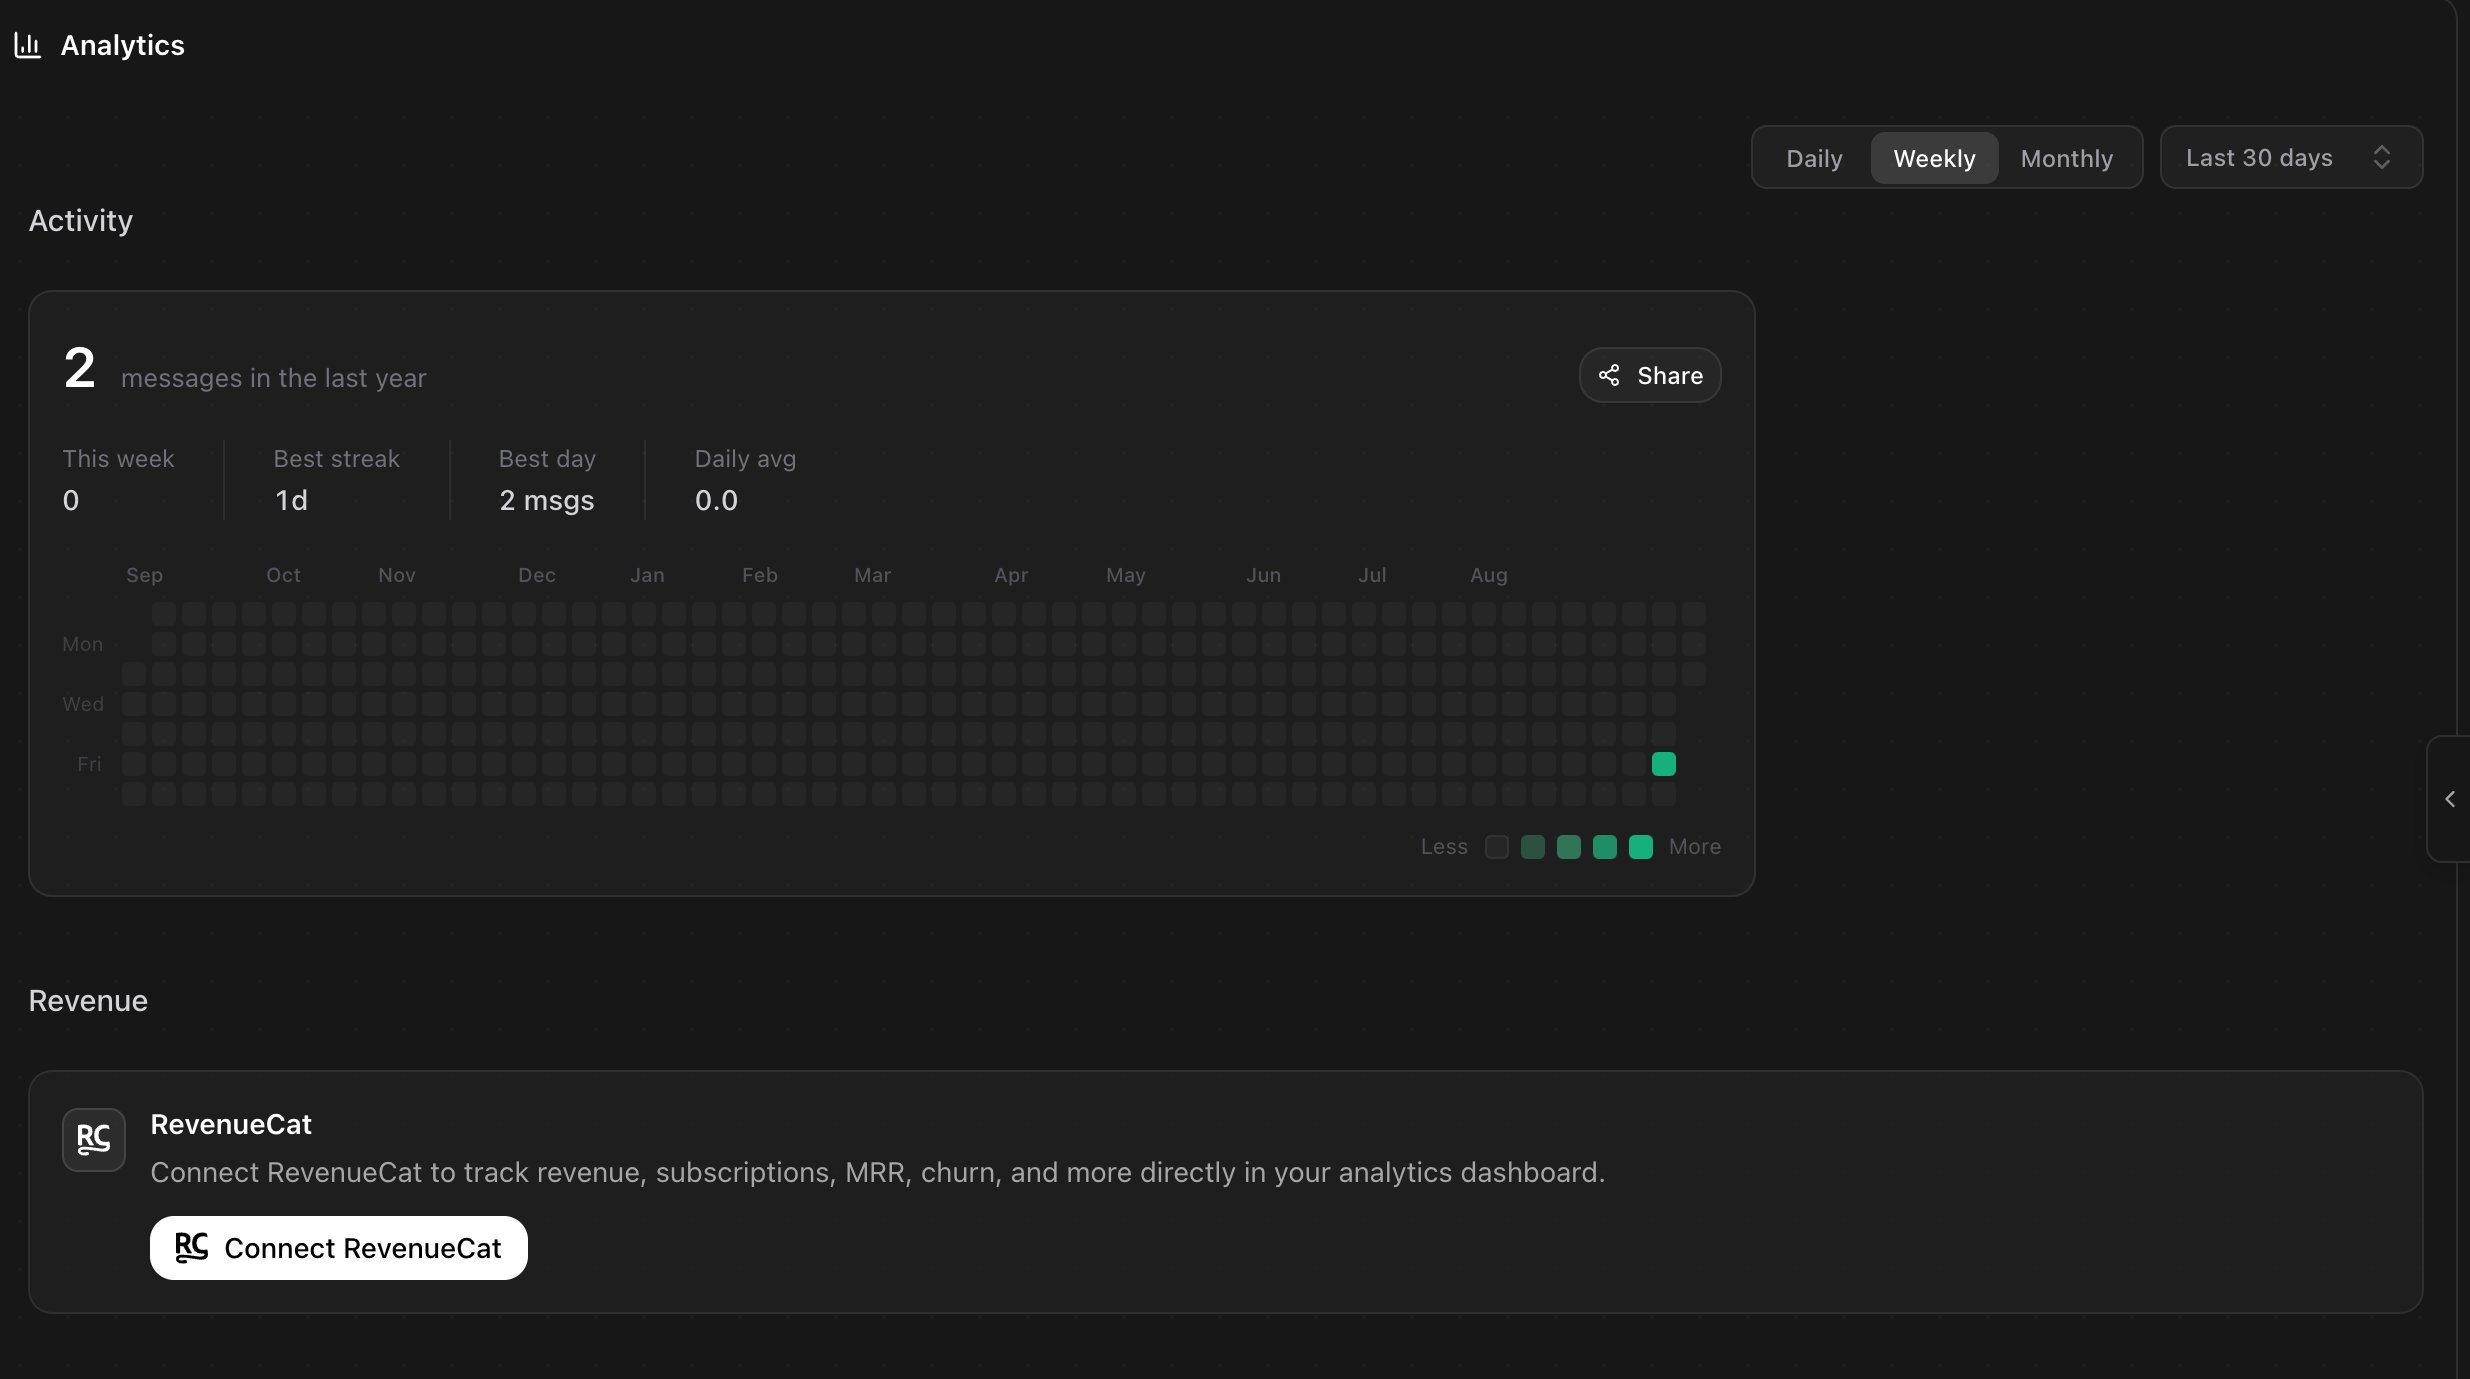
The Analytics tab in a young project. Activity counts your building, Revenue waits for RevenueCat.
Activity
Activity counts the messages you sent in this project, over the last year, as a heatmap. It is a picture of your own work, not of your users.
The Daily, Weekly, Monthly switch and the range picker above, from Last 7 days to Last 12 months, change how the charts are grouped.
Revenue
Revenue comes from RevenueCat, the service that handles in-app purchases and subscriptions in your app. Until you connect it, this section only offers the connect button.1
Press Connect RevenueCat
Rork opens RevenueCat and asks for access to your account.
2
Pick the RevenueCat project
Choose the project that matches this app, or press Create new project if you have none yet.
3
Read the numbers
The section fills with your app’s money.
- Total revenue and MRR, plus ARR and ARPU
- Active subs and Active trials
- Downloads, for the selected range and all time
- Conversion, and charts grouped as Overview, Revenue Metrics, Subscriptions, and Conversion
Connecting RevenueCat here is about reading the numbers. To make your app sell subscriptions in the first place, follow How to add a paywall with RevenueCat.
Ask Rork about your numbers
Evaluate metrics sends your activity and revenue snapshot into the chat and asks the agent to read it. You get a written assessment in the chat: what stands out, what looks weak, and what to try next. It is a normal message, so it costs credits like any other.What analytics does not include
- Your app’s users. Screen views, sessions, and retention are not here. Ask Rork to add an analytics SDK to your app if you need those.
- Web traffic. A published web app’s visitor numbers are not in this tab.
- Credits spent. That lives in your account. See Build credits vs Cloud credits, or open the ⋯ menu under any answer for the cost of that single message.
FAQ
Why does Activity say 2 messages when I have been building for weeks?
Why does Activity say 2 messages when I have been building for weeks?
Activity counts messages in this project only. Each project has its own graph.
I connected RevenueCat but see no revenue.
I connected RevenueCat but see no revenue.
Check that you picked the RevenueCat project that matches this app, and that the range you selected contains sales. A brand new app with no purchases yet has nothing to show.
Do collaborators see the revenue numbers?
Do collaborators see the revenue numbers?
Anyone with access to the project sees the tab. Invite deliberately. See Share a project and work together.
Can I track downloads without RevenueCat?
Can I track downloads without RevenueCat?
Not in this tab. App Store Connect and Play Console both report downloads on their own.
Next steps
Add a paywall
Set up subscriptions with RevenueCat.
Scale to $50k a month
What to do once the numbers start moving.
Credits
What building costs you, as opposed to what your app earns.
How the agent works
Design mode, Plan mode, and building.