> ## Documentation Index
> Fetch the complete documentation index at: https://docs.rork.com/llms.txt
> Use this file to discover all available pages before exploring further.

# Project analytics and revenue

> The Analytics tab shows how much you have built in a project and, once you connect RevenueCat, what your app earns: revenue, MRR, subscriptions, trials, and conversion.

export const CtaBanner = () => <div style={{
  display: "flex",
  alignItems: "center",
  justifyContent: "space-between",
  gap: "24px",
  flexWrap: "wrap",
  margin: "40px 0 8px",
  padding: "22px 28px",
  borderRadius: "16px",
  background: "linear-gradient(135deg,rgba(249,115,22,0.10),rgba(255,255,255,0.03),rgba(249,115,22,0.06))",
  border: "1px solid rgba(255,255,255,0.08)"
}}>
    <div>
      <div style={{
  fontSize: "19px",
  fontWeight: 700,
  color: "#fff",
  letterSpacing: "-0.3px",
  lineHeight: 1.3
}}>
        Build your app with Rork today.
      </div>
      <div style={{
  fontSize: "14px",
  color: "rgba(255,255,255,0.6)",
  marginTop: "4px",
  lineHeight: 1.5
}}>
        Ship iOS, Android, and web apps by chatting with AI.
      </div>
    </div>
    <a href="https://rork.com?utm_source=docs&amp;utm_medium=referral&amp;utm_campaign=docs-cta&amp;utm_content=cta-banner" onClick={tagCtaLink} style={{
  flexShrink: 0,
  display: "inline-block",
  padding: "10px 24px",
  background: "linear-gradient(135deg,#fff,#f0f0f0)",
  color: "#000",
  fontSize: "14px",
  fontWeight: 600,
  borderRadius: "100px",
  textDecoration: "none",
  whiteSpace: "nowrap"
}}>
      Try Rork for Free
    </a>
  </div>;

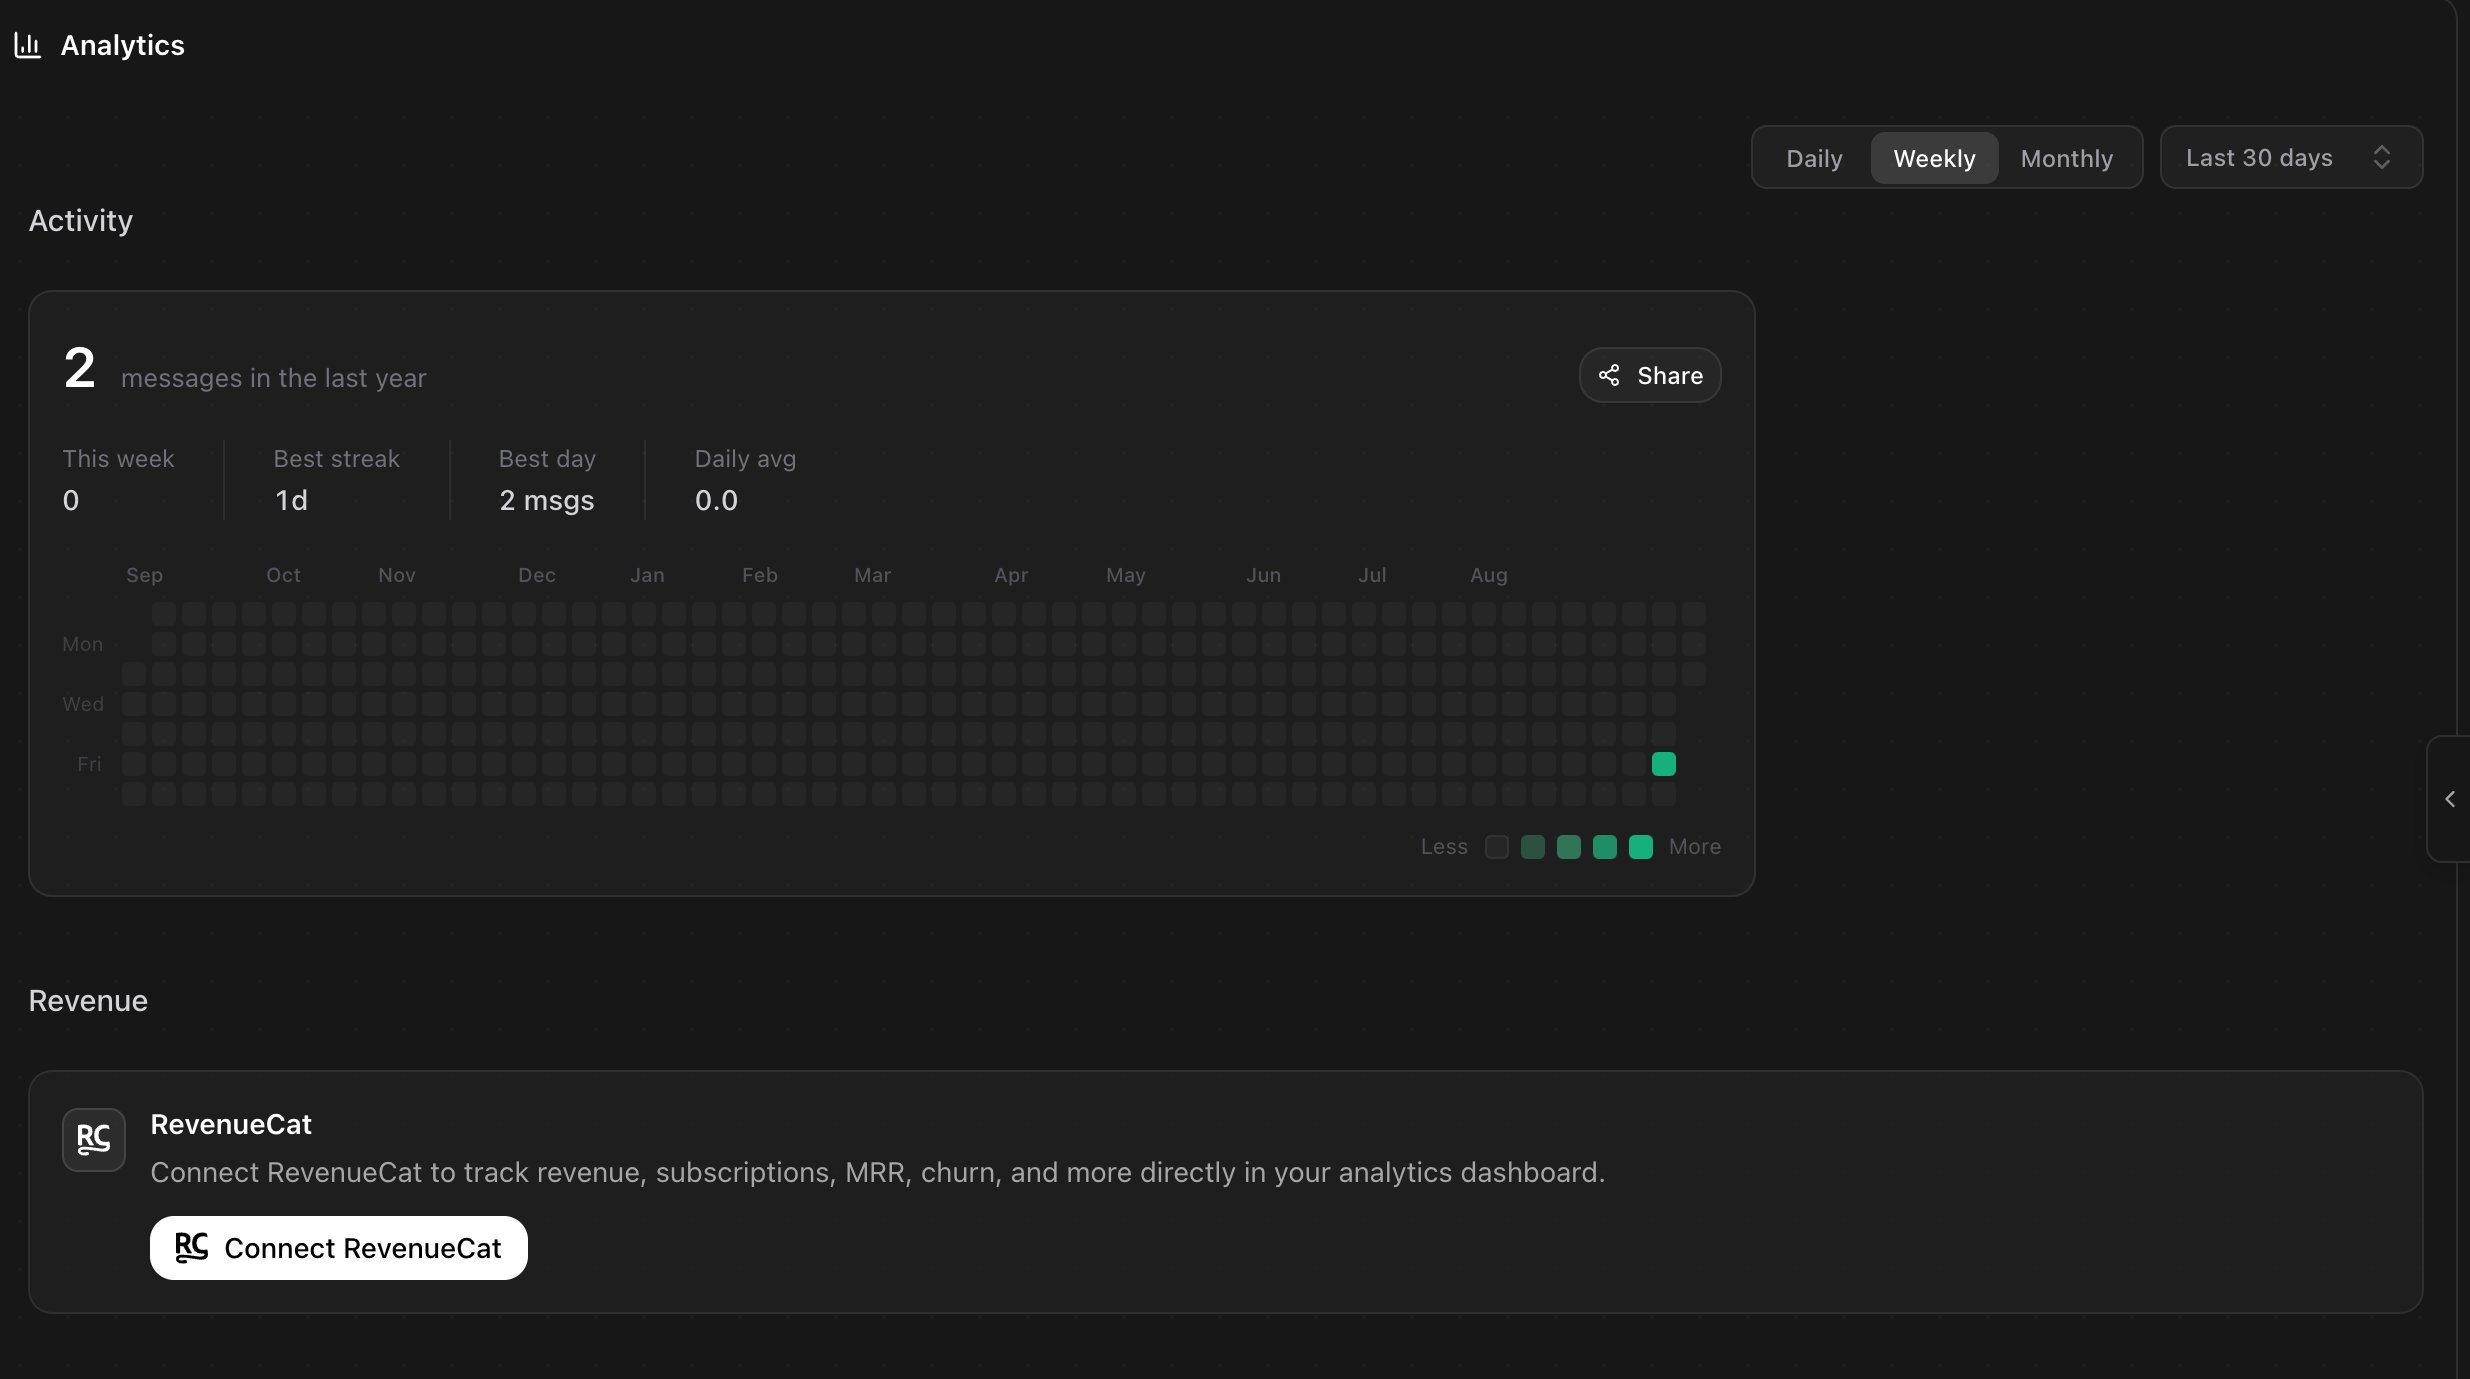
Open **More → Analytics** in a project. The tab has two halves: **Activity**, which is about your building, and **Revenue**, which is about your app's money.

<Frame caption="The Analytics tab in a young project. Activity counts your building, Revenue waits for RevenueCat.">
  <img src="https://mintcdn.com/rork/wazWVatNruwoHCrq/images/analytics/analytics-tab.png?fit=max&auto=format&n=wazWVatNruwoHCrq&q=85&s=28218dbffe174cba5468b35d03c8ac7c" alt="The Rork Analytics tab showing an Activity heatmap with This week, Best streak, Best day and Daily avg, and a Revenue section offering to connect RevenueCat" width="2470" height="1379" data-path="images/analytics/analytics-tab.png" />
</Frame>

## Activity

Activity counts **the messages you sent in this project**, over the last year, as a heatmap. It is a picture of your own work, not of your users.

| Stat            | What it counts                                       |
| --------------- | ---------------------------------------------------- |
| **This week**   | Messages you sent in this project this week          |
| **Best streak** | The longest run of consecutive days you worked on it |
| **Best day**    | The busiest single day, in messages                  |
| **Daily avg**   | Messages per day, averaged across the year           |

The **Daily**, **Weekly**, **Monthly** switch and the range picker above, from **Last 7 days** to **Last 12 months**, change how the charts are grouped.

<Tip>
  **Share** turns the graph into an image you can post. Pick what to include, press **Generate**, and Rork renders a PNG with your totals, the heatmap, and your streak.
</Tip>

## Revenue

Revenue comes from **RevenueCat**, the service that handles in-app purchases and subscriptions in your app. Until you connect it, this section only offers the connect button.

<Steps>
  <Step title="Press Connect RevenueCat">
    Rork opens RevenueCat and asks for access to your account.
  </Step>

  <Step title="Pick the RevenueCat project">
    Choose the project that matches this app, or press **Create new project** if you have none yet.
  </Step>

  <Step title="Read the numbers">
    The section fills with your app's money.
  </Step>
</Steps>

Once connected, the tab shows:

* **Total revenue** and **MRR**, plus **ARR** and **ARPU**
* **Active subs** and **Active trials**
* **Downloads**, for the selected range and all time
* **Conversion**, and charts grouped as **Overview**, **Revenue Metrics**, **Subscriptions**, and **Conversion**

If a range has nothing in it, Rork says so rather than drawing an empty chart: "RevenueCat has no revenue points in the selected range."

<Note>
  Connecting RevenueCat here is about **reading** the numbers. To make your app sell subscriptions in the first place, follow [How to add a paywall with RevenueCat](/payment-guides/revenuecat-copied-1).
</Note>

## Ask Rork about your numbers

**Evaluate metrics** sends your activity and revenue snapshot into the chat and asks the agent to read it. You get a written assessment in the chat: what stands out, what looks weak, and what to try next. It is a normal message, so it costs credits like any other.

## What analytics does not include

* **Your app's users.** Screen views, sessions, and retention are not here. Ask Rork to add an analytics SDK to your app if you need those.
* **Web traffic.** A published web app's visitor numbers are not in this tab.
* **Credits spent.** That lives in your account. See [Build credits vs Cloud credits](/billing/build-credits-vs-cloud-credits), or open the **⋯** menu under any answer for the cost of that single message.

## FAQ

<AccordionGroup>
  <Accordion title="Why does Activity say 2 messages when I have been building for weeks?">
    Activity counts messages in **this project** only. Each project has its own graph.
  </Accordion>

  <Accordion title="I connected RevenueCat but see no revenue.">
    Check that you picked the RevenueCat project that matches this app, and that the range you selected contains sales. A brand new app with no purchases yet has nothing to show.
  </Accordion>

  <Accordion title="Do collaborators see the revenue numbers?">
    Anyone with access to the project sees the tab. Invite deliberately. See [Share a project and work together](/collaborate/share-a-project).
  </Accordion>

  <Accordion title="Can I track downloads without RevenueCat?">
    Not in this tab. App Store Connect and Play Console both report downloads on their own.
  </Accordion>
</AccordionGroup>

## Next steps

<CardGroup cols={2}>
  <Card icon="credit-card" href="/payment-guides/revenuecat-copied-1" title="Add a paywall">
    Set up subscriptions with RevenueCat.
  </Card>

  <Card icon="megaphone" href="/rork-playbook/scale-to-50k-month" title="Scale to $50k a month">
    What to do once the numbers start moving.
  </Card>

  <Card icon="coins" href="/billing/build-credits-vs-cloud-credits" title="Credits">
    What building costs you, as opposed to what your app earns.
  </Card>

  <Card icon="sparkles" href="/features/agent-modes" title="How the agent works">
    Design mode, Plan mode, and building.
  </Card>
</CardGroup>

<CtaBanner />
